
Visualizing decision tree
A couple of days ago, a friend of mine asked me to do a mini-project on decision tree classification. But I shouldn’t use packages such as scikit learn and I had to write it from scratch. I completed it and hand it over. Then he asked me to do bonus part of this project, which was visualizing the tree without using any packages. I had some fun doing it, so I thought maybe I can share it here ;).
As you may know, to build a decision tree, we need to write it as a recursive function, so that for every node, we build a tree using its children. I used Rohit’s code here:
class Node(object):
    def __init__(self):
        self.value = None
        self.decision = None
        self.children = None


def buildTree(X, y, rows, columns):
    maxGain, idx, ans = findMaxGain(X, y, rows, columns)
    root = Node()
    root.children = []

    if maxGain == 0:
        if ans == 1:
            root.value = 'p'
        else:
            root.value = 'e'
        return root

    root.value = features[idx]
    mydict = {}
    for i in rows:
        key = X[i][idx]
        if key not in mydict:
            mydict[key] = 1
        else:
            mydict[key] += 1

    newcolumns = copy.deepcopy(columns)
    newcolumns.remove(idx)
    for key in mydict:
        newrows = []
        for i in rows:
            if X[i][idx] == key:
                newrows.append(i)
        temp = buildTree(X, y, newrows, newcolumns)
        temp.decision = key
        root.children.append(temp)
    return root
I didn’t bring findMaxGain function here for simplicity, but you find the full code in his repo. So as you can see, the buildTree function is used recursively.
I needed another function to traverse this tree and visualize the nodes in a hierarchical manner, something like in below:
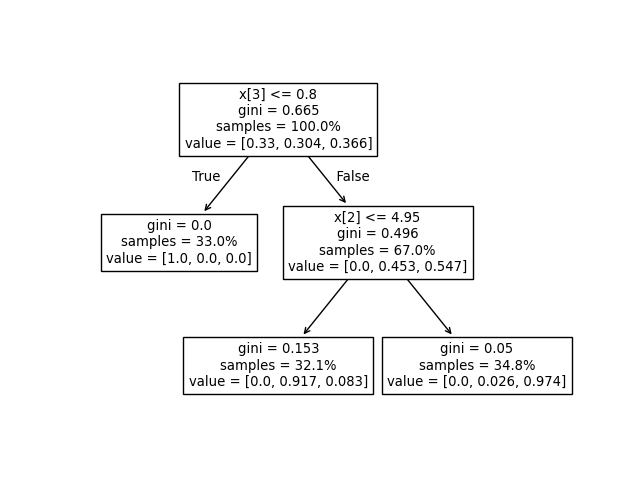 source: scikit-learn.org
But how can I create such visualization in command line? How can I print those arrows in text? I searched a bit and found export_text function (link) in scikit-learn. It visualizes the levels of tree in a horizontal manner. In this way, you don’t need to worry about all of the vertical arrows in the graphical figure. Bingo! Using this idea, I changed the traverse function of Rohit’s code to this:
def traverse(root, level=0):
    print('\t'*level + f"=={root.decision}==> {root.value}")

    n = len(root.children)
    if n > 0:
        for i in range(0, n):
            traverse(root.children[i], level=level+1)
There are two things to consider here. First is the level argument of the function, which tracks the depth of this recursive process (or in this case, depth of the decision tree). Second is the print statement, which does the trick for visualization. With each depth level, I add one tab to the string (using the '\t'*level). You can see the result in below:
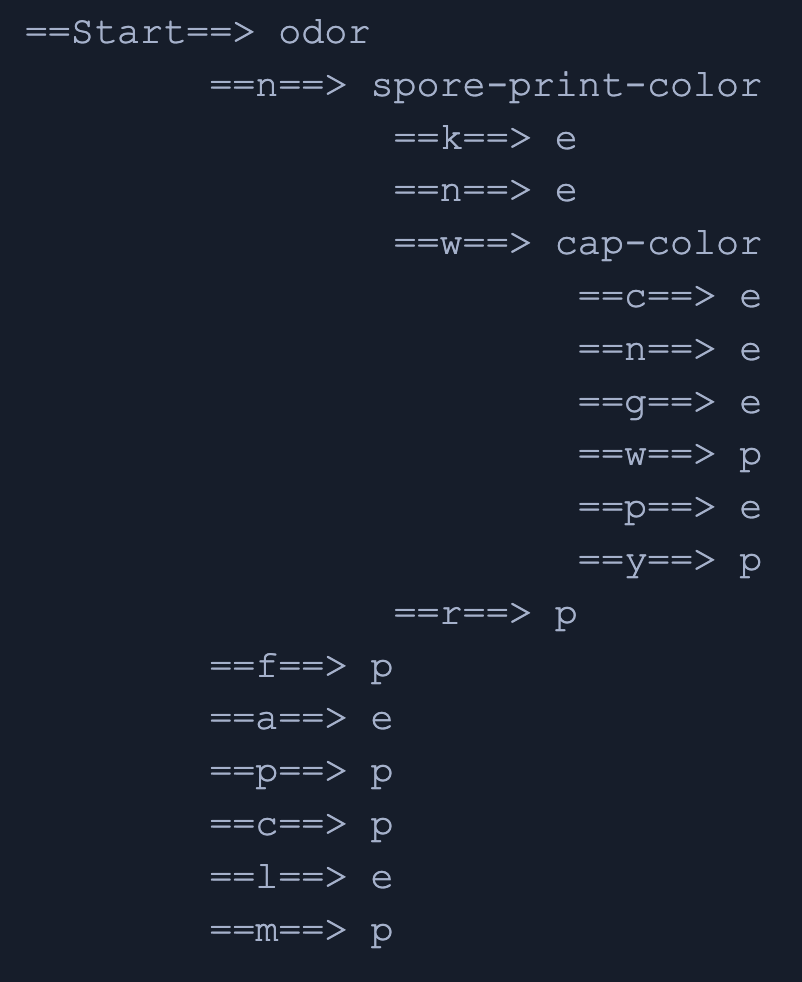
Neat :). Isn’t it? Thank you for reading.